Cynthia Campos

Hi, my name is Cynthia. With 6+ years of professional experience working with data, I found myself enjoying solving the challenges that come with analyzing and communicating big data sets. Since I have always enjoyed solving puzzles, finding patterns and solutions that nobody else sees is the drive for me.
Extracting, cleaning, and visualizing data are skills that I will continue to master. If I could be of any value to you, please reach out to me. Thank you!
View My LinkedIn Profile
View My Tableau Profile
Airbnb Listings in Amsterdam Project
Project description: Real Estate Investors are planning to purchase several rental properties in various cities around the world over the next few years. They want to list these rental properties on Airbnb and decided their first purchase will be in Amsterdam, Netherlands. Before they pursuit their purchase, they would like clear data about Airbnb property performance in Amsterdam. Their objective is to get information in respect to which location to buy and how much annual income they may be able to earn.
1. Frame
The question that frames our focus is, “Based on potential revenue, in which Amsterdam neighborhood should these investors buy their first property?”. From this question, it provides the direction on what the analysis should answer in the end.
2. Extract
I was provided with two large databases with each one containing over 100,000 records. One of the database contained the airbnb listing information, and the other contained the rating information. Both tables had critical information for the analysis, therefore I performed an SQL query to create a dataset.
Below is the following SQL query that I performed.
SELECT listings.id, listings.listing_url, listings.availability_365, listings.room_type,listings.accommodates, listings.guests_included, listings.extra_people, listings.property_type,listings.bed_type, listings.neighbourhood, listings.city, listings.security_deposit, listings.price,listings.minimum_nights, listings.maximum_nights, listings.cleaning_fee, ratings.review_scores_rating, ratings.number_of_reviews,listings.reviews_per_month, (listings.reviews_per_month * 2)
AS bookings_per_month,
(CASE WHEN minimum_nights > 3.9 THEN minimum_nights
WHEN maximum_nights < 3.9 THEN maximum_nights
ELSE 3.9
END)
AS days_per_booking,
(CASE WHEN accommodates = 1 then 1
  WHEN accommodates >1 THEN 2
  ELSE 2
 END)
 AS guests_per_booking
FROM listings
LEFT JOIN ratings
ON listings.id = ratings.id
WHERE neighbourhood NOT LIKE 'Centrum-oost' AND neighbourhood NOT LIKE 'Centrum-West'
AND room_type = 'Entire home/apt';
3. Wrangle / Prepare
After extracting the dataset into Excel, I cleaned up the data by getting rid of null or missing values and replacing it with the average values of that column. Then, I was able to create pivot tables to create visualizations.
I decided to create the visualization dashboard in Tableau.
4. Analyze / Interpret / Communicate
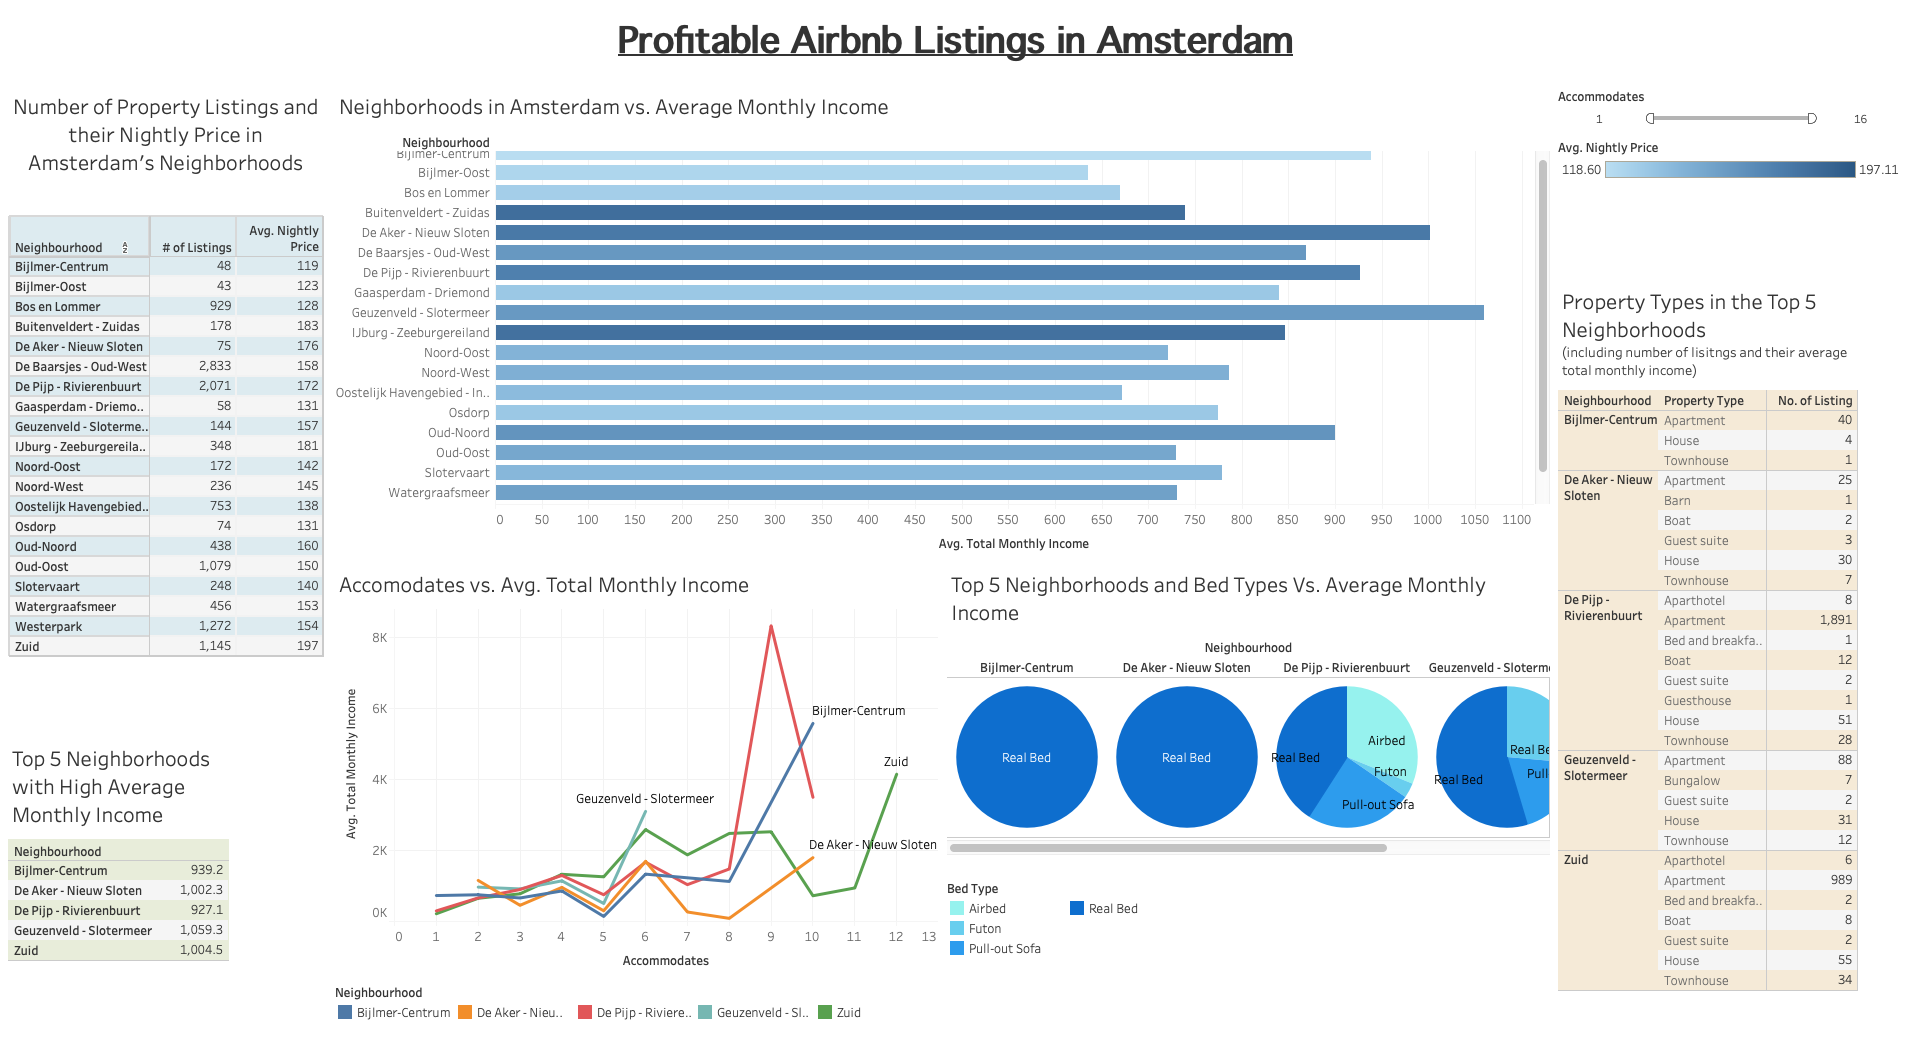 Through analyzing the following dashboard, my specific recomendation is for the investors to purchase houses in neighborhoods of Geuzenveld-Slotmeer and Bijlmer-Centrum that can accomodate 2-6 people and to provide real beds.
Even though Zuid is a highly profitable and popular neighborhood, there is a high concentrated amount of listings that will drive the supply up and the demand down, resulting in lower bookings in the future. Also, outliers such as varying property types that produce high income may result from different factors out of our control, like views, services, amenities, architecture, etc. Those two neighborhoods are the best options from the data analyzed.
For more details see GitHub Flavored Markdown.